Hololens Experience Center
Created interactive holograms for the Microsoft Hololens for Fractal Analytics.
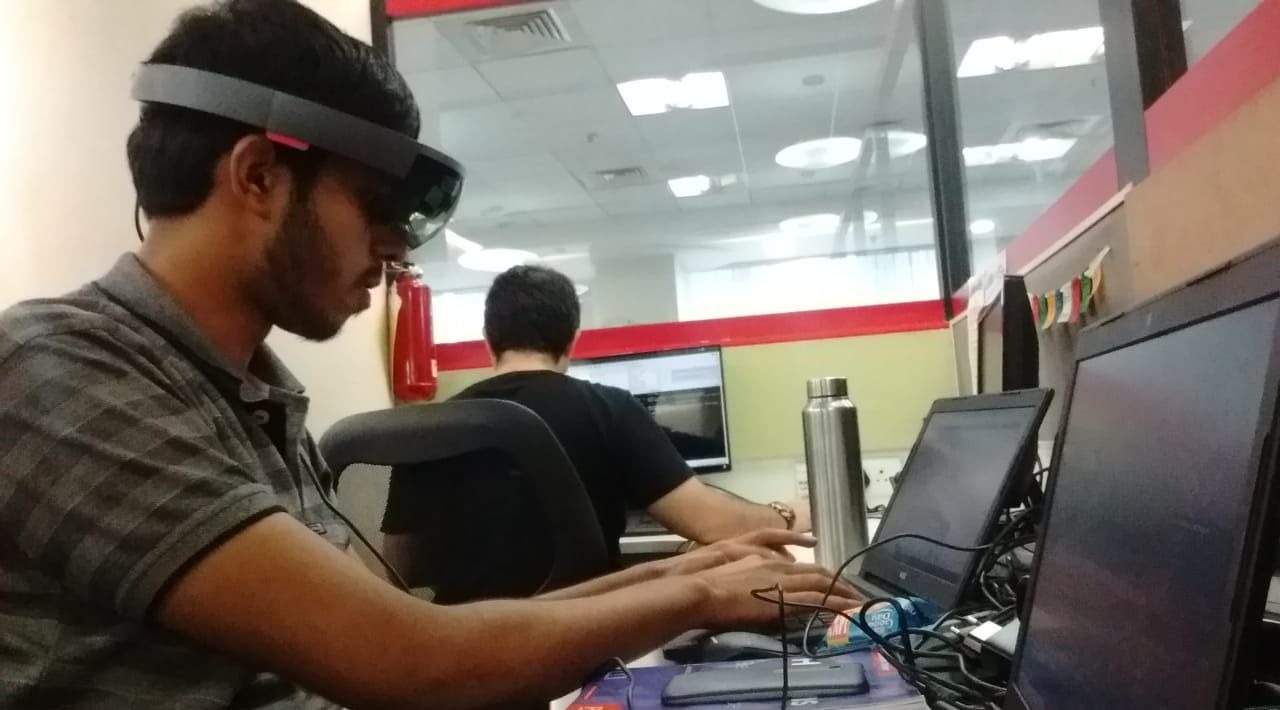
Microsoft HoloLens is a self-contained, holographic computer, enabling you to interact with holograms in the world around you. During December 2017, Chirag (my undergrad classmate) and I worked with this wonderful device at our month-long internship at Fractal Analytics.
The idea was to have conventional statistical results presented in the form of holograms which provide a much more interactive and intuitive feel to the results.
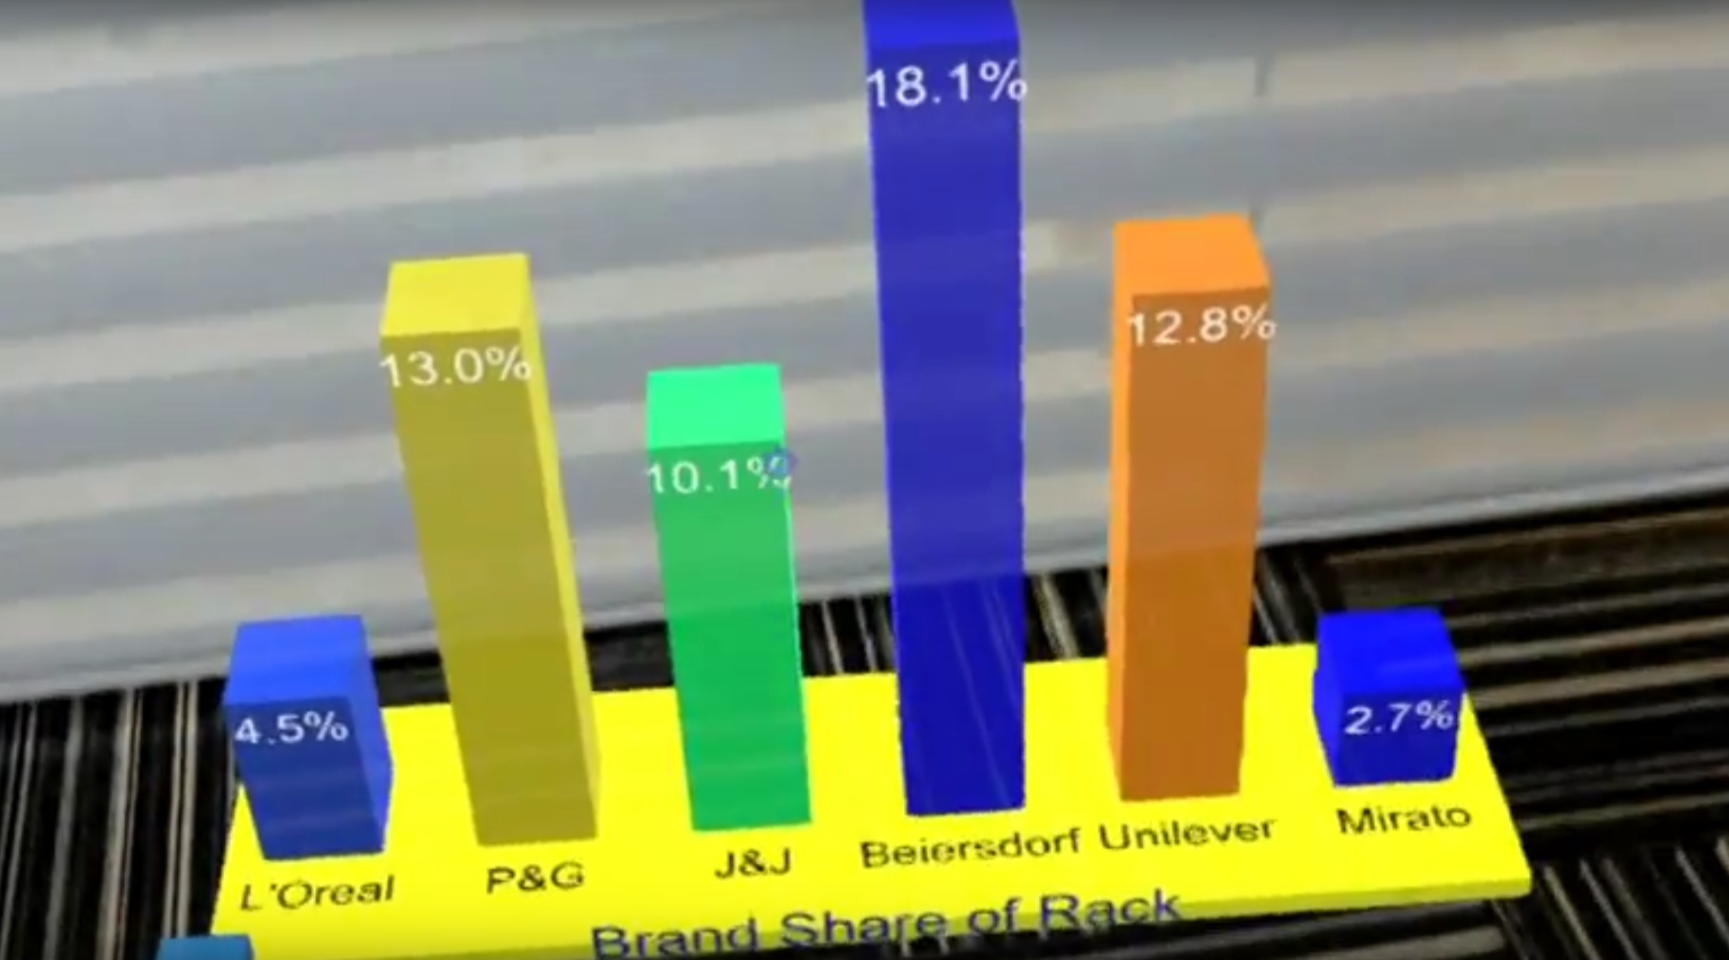
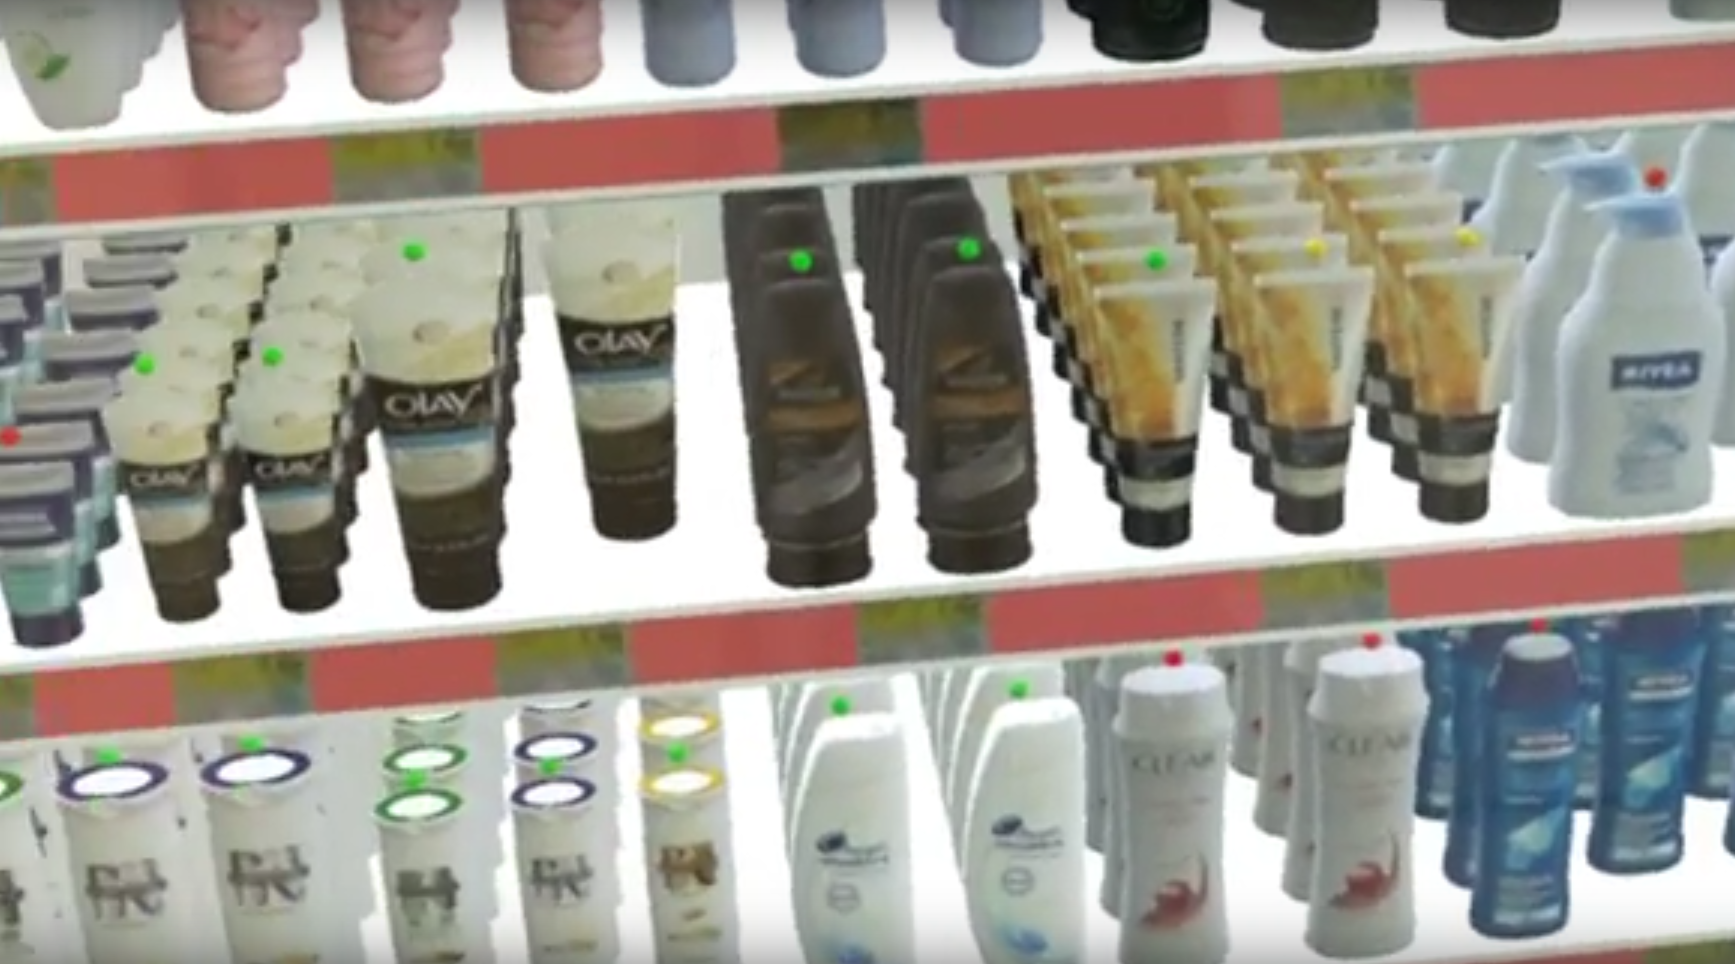
We built an application in which one can interact with the products kept on the holographic shelf and then see the resulting analyses in the form of pie charts, bar graphs, and heat maps.
The following playlist of 3 videos demonstrate our developed applications:
The main use cases were:
- Share of Sight Analysis
- This analysis shows the amount of attention each shelf receives from the user.
- This is used by the consumer packaged goods (CPG) industry to determine the ideal placement of the products on a shelf.
- We compute and showcase the share of sight in an easy to understand pie chart as well as a heat map.
- Share of Shelf and Share of Rack Analysis
- This analysis shows the share of a product/brand on a retailer’s shelf.
- Share of shelf and share of rack analysis is crucial in the CPG industry because a product/brand needs to be present both in terms of quality and quantity on a shelf to stand out from the competition.
- Compliance
- This use case shows the compliance of the share of a product/brand on a retailer’s shelf as per the agreements with the manufacturers.
We had to completely plan, design and develop the application ourselves, which was fun as we learned everything from scratch. The application development relied on C# and helped strengthen object-oriented programming concepts. Also, this was my first experience working in a corporate environment, and the free coffee and chips were mercilessly looted and savoured by us!


